 Number 293 - October 2007 |

|
| Vista and the Reliability & Performance Monitor | |
|
by Vinny La Bash, vlabash@comcast.net, Sarasota Personal Computer Users Group, Inc. | |
|
Anyone who has spent time trying to understand the Windows XP Performance Monitor is going to love Vista's Reliability & Performance Monitor. No more will you have to figure out what the various performance procedures are really measuring. All the confusion has been eliminated and a well-designed screen utility makes everything vastly simplified. Every time you run a program on your system, performance is affected in some way. The new Vista Performance Monitor allows you to track these operations on a real-time basis or to collect data for analysis at a later time. The utility does this by taking configuration information, performance counters, data specific to program events, and then merging everything into Data Collection sets. Microsoft has prefigured all the important details into a completely revised utility that is not only easy to use, but easy to understand. This new utility provides you with a set of preconfigured elements that you can use to monitor the reliability of your system. This article will give you a detailed overview of the Reliability Monitor, and show how to use its System Stability Chart to track how your system behaves. Here's how to get to the Reliability and Performance Monitor: An alternate selection method is to right-click the orb and type reliability in the Start Search text box. Either way the Computer Management dialog box will appear. Expand the Reliability and Performance branch and the Monitoring Tools branch by clicking on the arrows adjacent to their icons. (See illustration) Click the Reliability Monitor icon and it will appear in the center pane. Click both Show/Hide Console Tree and the Show/Hide Action Pane buttons to fill the screen with the Reliability Monitor. To get the best perspective, maximize the window. Dragging the scroll bar all the way to the left brings the Reliability Monitor back to the beginning of time, that is, to when Vista was installed. 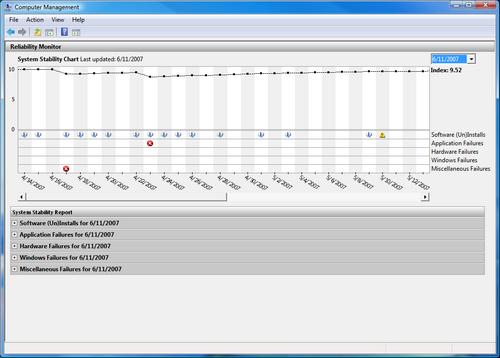
The line diagram in the upper part of the window is the main feature of the utility. This line is called the stability index. Vista starts out with a reliability rating of 10 which is the best you can hope for. Scroll back to the right as far as you can go, and you will see your current rating. Drag the scroll bar slider back and forth, and you will see the day-to-day flow of the Stability Index as various events play themselves out. |
Notice that the middle portion of the window is sprinkled with icons divided into labeled rows. Let's see what they are telling us: Software (Un)Installs: The yellow triangle with question marks and the circles with lower case "i"s show the date or dates when: Those are the major examples. This can be very useful information when trying to troubleshoot a problem. 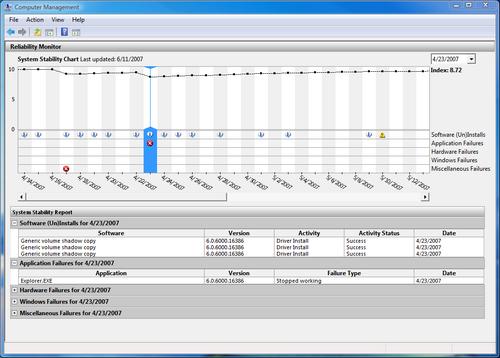
Application Failures (Fiure 2): This is the area that strongly affects your Reliability Index. Any day that has a red circle with an X drops the Reliability Index significantly. This is like a public company announcing a bad earnings report. Its stock can drop dramatically very quickly. The Reliability Index will increase slowly as long as no other application failures occur. If necessary, you can quickly find any application that's trashing your system. Hardware Failures and Windows Failures: There are hardware and Windows failures so severe that you may not be able to access the utility until after the problem is fixed. For less severe troubles, the tool will tell you about a hard drive failure, modem malfunctions, mouse failures, and others. Miscellaneous Failures: This is a catch-all area that reports problems that don't fit neatly into any of the other categories. For example, the utility will report a situation where Windows did not shut down properly as a Disruptive Shutdown. Vista's Reliability Monitor makes it easy to track events that affect your system. It's a great troubleshooting aid because you can quickly find out what is causing a problem and when it started. The Monitor's ability to record trend analysis data, with detailed information about specific events, tells you everything you need to know about your computer from the day Vista was installed. Copyright 2007. This article is from the August 2007 issue of the Sarasota PC Monitor, the official monthly publication of the Sarasota Personal Computer Users Group, Inc., P.O. Box 15889, Sarasota, FL 34277-1889. Permission to reprint is granted only to other non-profit computer user groups, provided proper credit is given to the author and our publication. TOGGLE Editor's Note: The figures from the original article were unavailable on line so have been substituted from another source without changing the meaning of the text. |
|
Number 293 - October 2007
|
|